The Rise of GenAI
For at least six years, I've steadily noticed an increasing presence of AI-generated images online. In the last three years alone, generative images have become a staple across social media platforms and appear frequently in online advertisements. One of the more recent events that caused some pitchforks to start swinging was this Coca-Cola AI-generated holiday ad that really stirred things up online.
But don't get me wrong, I'm a fan of fine-tuning, or even creating some data moshed AI slop, myself. I really enjoy curating my own data and seeing how, with different hyperparameters, a model learns to represent and express it. When you fall into a good pace, it feels very satisfying to put the pieces together and create something really unique.
It's Only Getting Better
Doom, gloom, ethics, politics, and circular arguments aside... the quality of these AI-generated images has improved dramatically over the years thanks to a robust open-source community, dedicated research teams, and some of the world's largest tech companies investing in developing and training generative models, publishing their research for others to experiment with and build upon. Still, after hearing all the noise and arguments online about this, you might find yourself wondering: how does this technology actually work? What are these models doing? How can a computer tell what's in an image?
Before you start speculating about how some magical black-box computer program turns numbers into a detailed, high-resolution masterpiece (after you eighty-six the hands), let's talk about something one step down, and much simpler: what it really means for a computer to "see" an image, and how it might learn to tell what's in it.
Understanding the Basics of Machine Learning
First, let's state the obvious: computers don't "see" things in the same way we do. In fact, nothing about AI actually mimics brain functions. Instead, think of a simple machine learning model as a function approximation device. During training, the model learns the relationship between an input and a provided output. It asks itself: "Given this input, what gets us to that output?", thus creating its own set of rules and methods to try to represent that data.
To boil it all down: any input to the model must be encoded (ie represented as a set of numbers, often through some process like one-hot encoding). The model then multiplies those numbers against its "weights" (randomly initialized numbers inside of the model), and adds a learned bias. These weights are iteratively tweaked until they represent the input data in some meaningful way. With the right settings, a model can be trained to fit most data distributions.
How a Computer Sees an Image
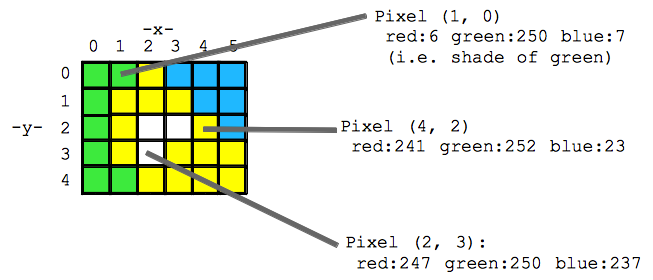
In essence, an image is made up of pixels, each represented by RGB values. These RGB values form three separate "channels" of the image. Imagine a 64px x 64px image as a 64 x 64 x 3 grid, where 3 corresponds to the Red, Green, and Blue channels. Therefore, every image is a matrix of size WxHx3 (width x height x 3 color channels).
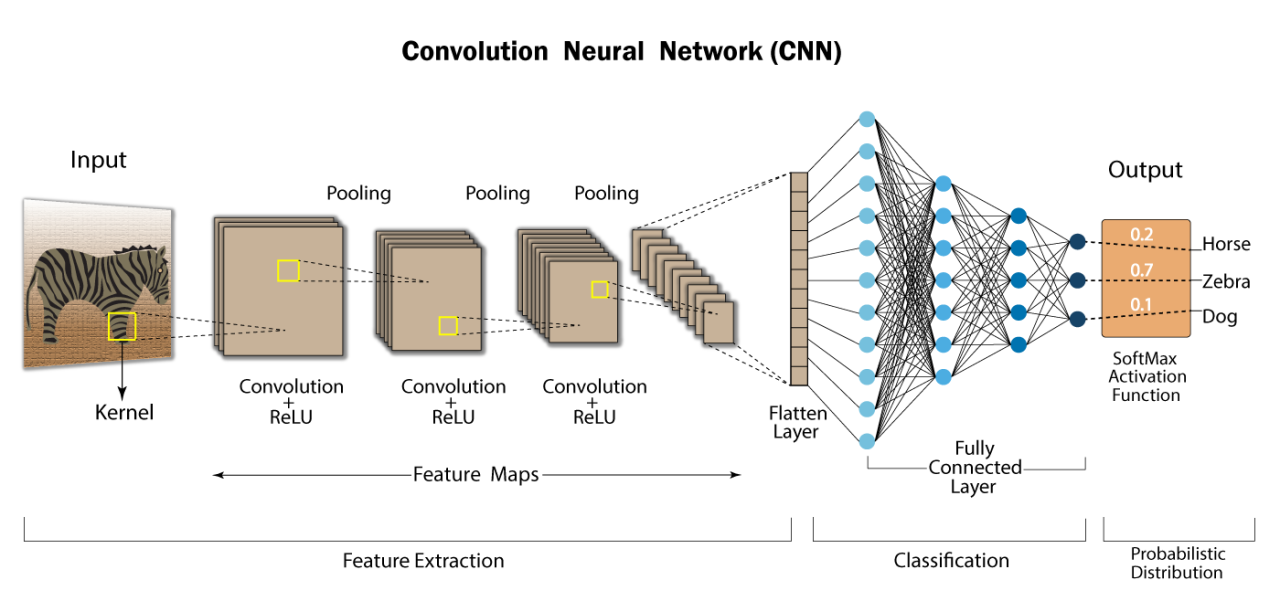
This is where a convolutional neural network comes in. CNNs are designed to process this kind of data.
For an in-depth explanation of Convolutional Neural Networks (CNNs), complete with interactive visualizations, check out CNN Explainer. I'll provide an overview of the process below, but the interactive visualizations are a great way to get a feel for how CNNs work by actually seeing the process in action, step by step, neuron by neuron.
How a CNN Makes Sense of an Image
Within each color channel, the pixel values are "normalized," and scaled between 0 and 1 (typically derived from a 0 - 255 range in standard RGB). These values are then multiplied by the model's weights, initially random when the model is created, and positioned at each pixel within a sliding kernel.
Kernels and Convolution
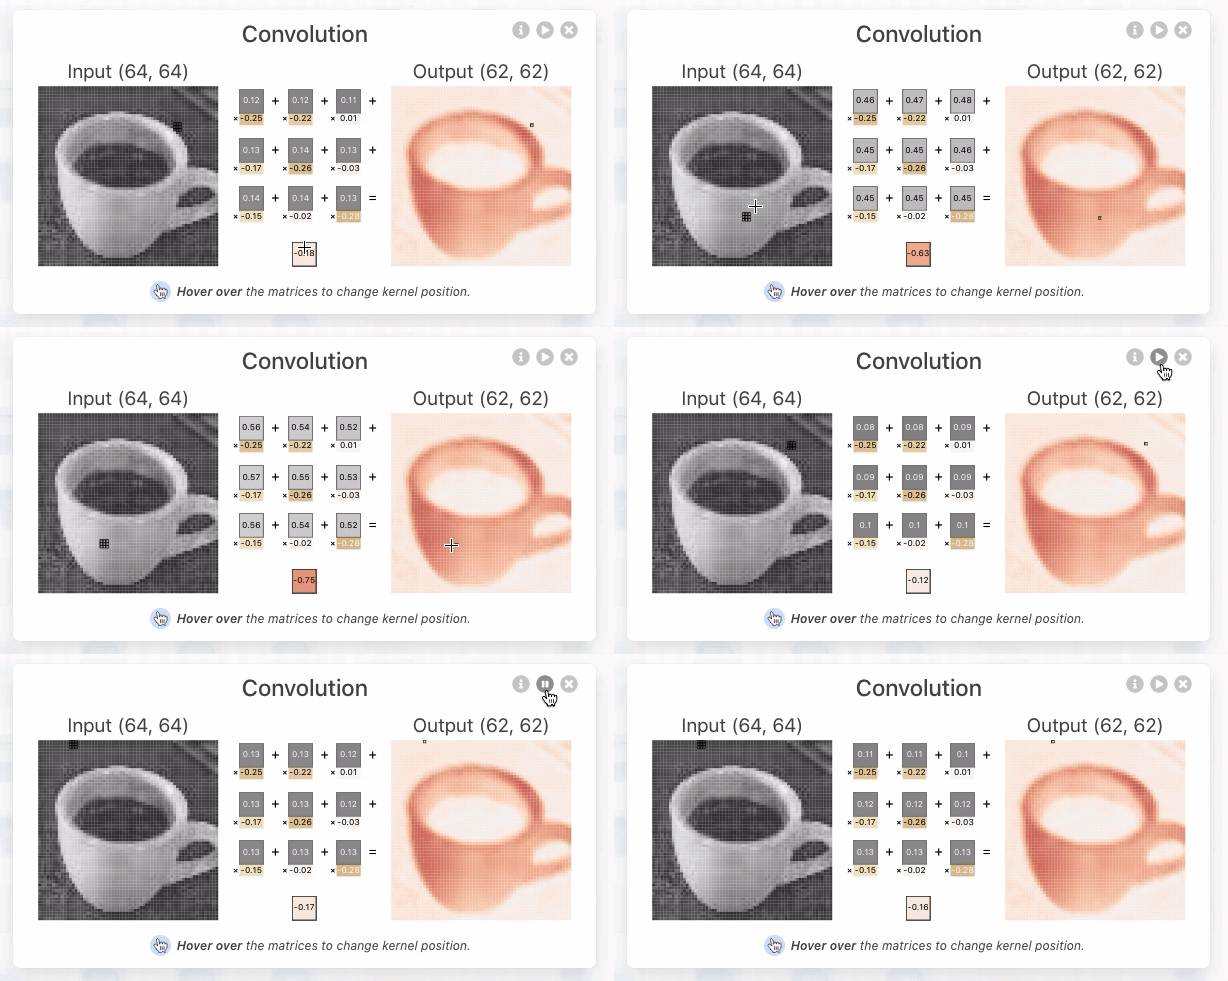
In the figure below, a small grid scans a single color channel from an image of an espresso cup. This grid (e.g., the 3 x 3 square) is the kernel or filter. The kernel size is a model architecture parameter (defined when creating the model). Each kernel position's value is a weight (highlighted in yellow), initially assigned a random number between -1 and 1, and gets adjusted during training. The stride length—how far the kernel moves per step—is another architectural design choice. With a stride length of 1, the kernel moves right by 1 pixel at each step.
For each kernel position, an element-wise multiplication (dot product) occurs between the kernel and the corresponding 3x3 block of the input image. We sum these multiplications to produce a single number, becoming the output value for the pixel's corresponding location in the output matrix, known as an "activation map". Each kernel is initialized with different sets of randomized weights, so this means that they will often create completely unique attention maps representing the way it makes sense of our data.
Activation Maps and Functions
The convolution operation produces what's called an "activation map" or "feature map". Each kernel in a convolutional layer creates its own unique activation map, representing different features it has learned to detect. While we often talk about "neurons" in neural networks, in CNNs it's more accurate to think about the kernels and their resulting feature maps. Each row in a convolutional layer's output represents a different feature map, showing what patterns that particular kernel has learned to identify in the input image.
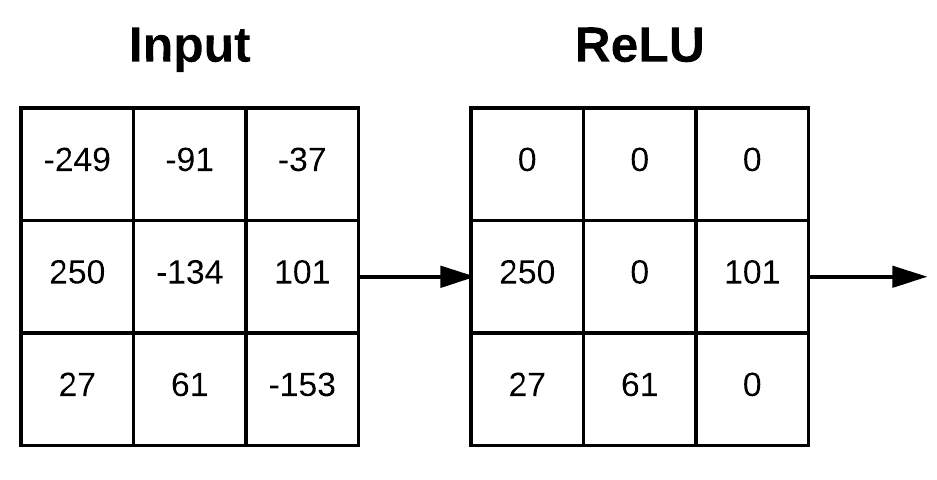
The activation map then undergoes an "Activation Function", which I discuss in detail here. All this means is that for every value in our activation map, we perform some operation. These functions often act as a sort of clamp or filter, introducing non-linearity by adjusting different values in different ways, based on their magnitude. In our example, the ReLU activation function clamps any negative value to zero.
The Role of Pooling: Refining Features
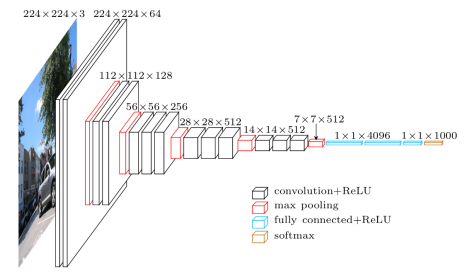
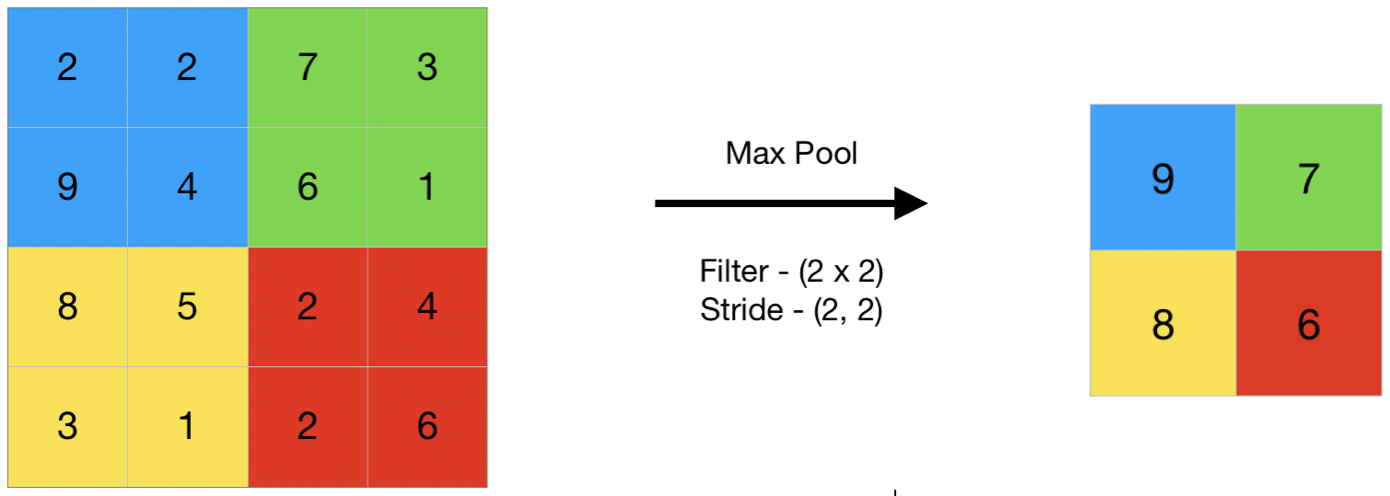
The CNN process often involves several iterations, or blocks of convolution and activation layers, with pooling layers in-between. The pooling layer acts as a down-sampling step, reducing the spatial dimensions of the data and emphasizing the most prominent features. In other words, it takes an average across areas in our activation maps, and reduces them down to a single output. One common method, known as "Max Pooling", extracts the maximum value from each slice that its kernel covers. This operation helps to simplify the data while retaining its essential characteristics.
Flattening Layers for Classification
After a series of blocks, repeating these operations until our data is downsampled to a sufficient size, the CNN data finally undergoes a transformation known as flattening. This step is crucial because it reshapes the data from a multi-dimensional format (a large matrix of pixel values) into a one-dimensional vector (a single array of numbers). This prepares it for the network's decision-making phase. This flattening isn't merely about reshaping; it's about readying the data for the classification process.
The flattening layer acts as a bridge between feature extraction and classification, enabling the use of functions like Softmax, which require a one-dimensional input. Softmax is integral for classification as it assigns probabilities to each potential class (or label, predefined by our training data), guiding the model in determining the most likely category for the input data.
How Computers Learn: Randomness to Recognition
So, we know how a computer "sees" an image, and how it determines what that image is comprised of. But that leaves the question: how did that model learn which label corresponds to which image?
Well, through training of course! This brings us to the concept of "loss".
Loss Functions and Gradient Descent
As the model trains, it continually compares its predictions (what it thinks is in an image) against the true labels of the training data (what is actually in an image), calculating the difference—known as "loss." This loss is determined by a loss function (defined during the model's architecture design), which quantifies just how off the model's predictions are. The next step of training involves using this loss to adjust the model's weights, which initially start as random values.
The adjustment process involves calculating gradients, which represent the directions and magnitudes in which the model's weights need to change to minimize the loss value. This is done through a process called backpropagation, which iteratively updates the model's parameters to improve its predictions and align them more closely with the actual data and its distribution.
Making Predictions and Generalization
Once trained, we can begin running inference (i.e. making predictions) with our model. This is the moment when we test our model to really see if it knows anything about the task we want to use it for, or if it's a wash and must be trained again after some adjustments. The ultimate goal here is for the model to apply its acquired knowledge to classify or interpret new, unseen data.
The real test of a CNN's effectiveness lies in its ability to generalize. Generalization refers to the model's capacity to not just perform well on the data it has seen during training but to extend its accuracy to new data that it has never encountered. It's important to recognize that while no model can predict with perfect accuracy, a well-crafted CNN should be adept at approximating the true values of new data it encounters.
Closing Thoughts
To be honest, what machines (particularly neural networks and GPUs) accomplish today is nothing short of remarkable. It almost seems impossible that any of it works at all. We've seen that these systems, though devoid of genuine 'sight', have become adept at mimicking human-like perception by extracting meaningful relationships out of data in clever ways.
While we might sometimes marvel at this technology, it's the underlying principles and processes—like those we've discussed—that truly fuel this revolution. Understanding them and their implications could be crucial as we move into a world which is increasingly filled with more complex models and ever more ChatGippity wrapper applications.


